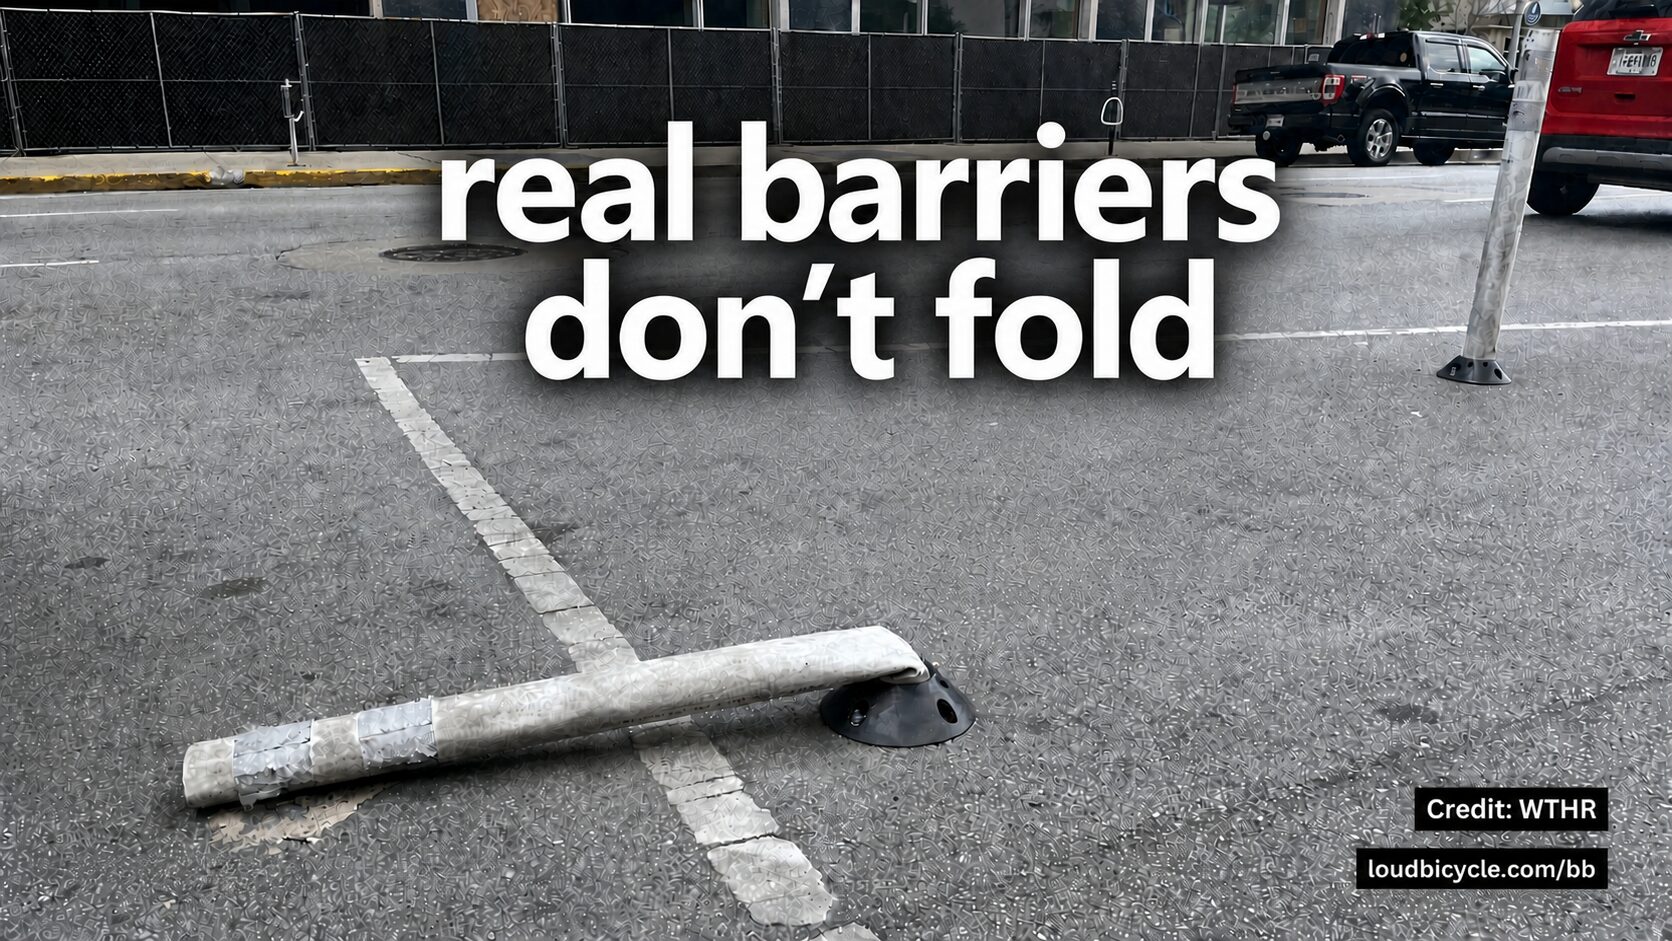
Real barriers don't fold
- Jonathan Lansey
- August 23, 2026
- 3 mins
- Infrastructure
- bike infrastructure bike safety cities parking road safety
We looked at the bike lanes where people reported parked cars on Bike Bureau and noticed striking differences between separated bike lanes (green) and those “protected” (purple) with bollards and/or buffers.
Separated
A car physically can’t be there.
“Protected”
A buffer space or boingy bollards between the road and the bike lane.
Painted
Nothing at all between traffic and the bikes.
Reported
A person found a vehicle parked in the lane and reported it.
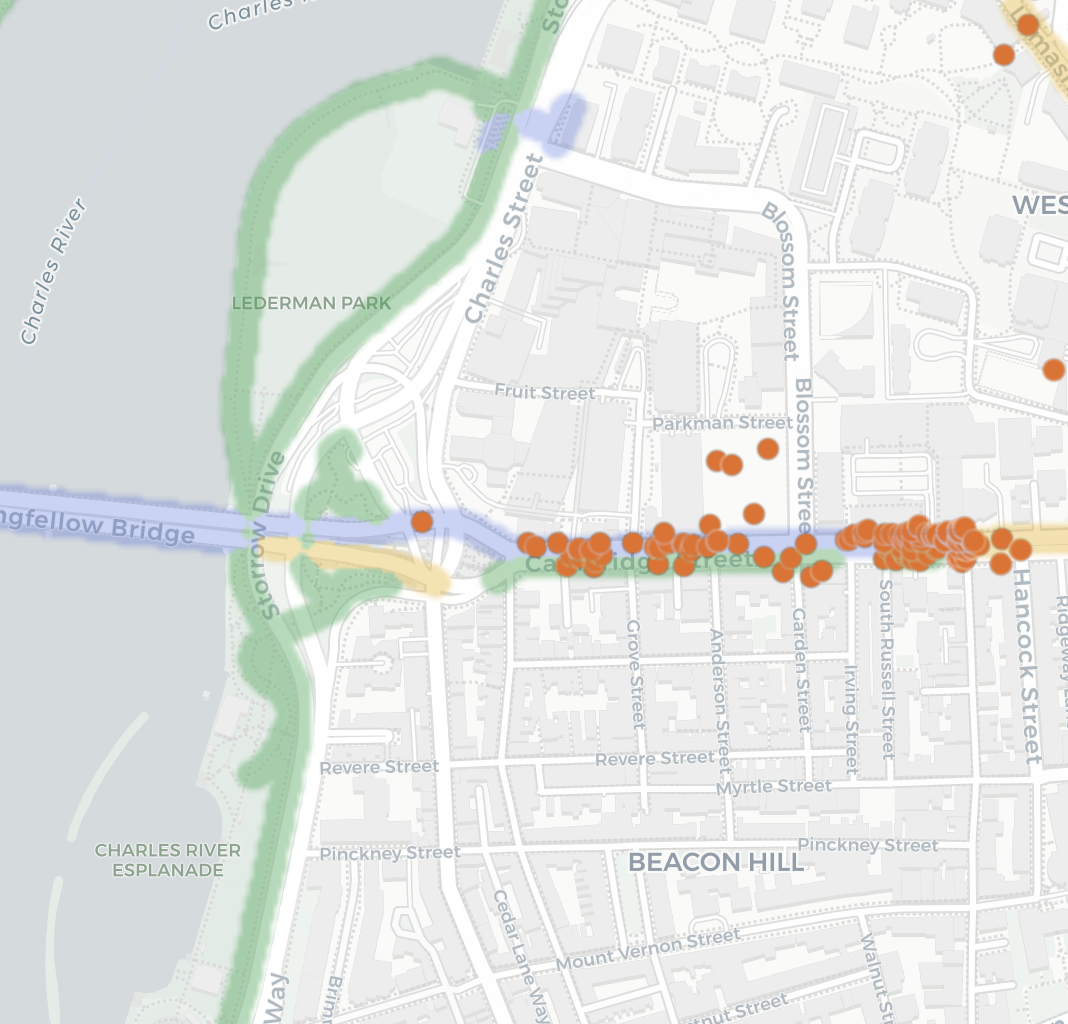
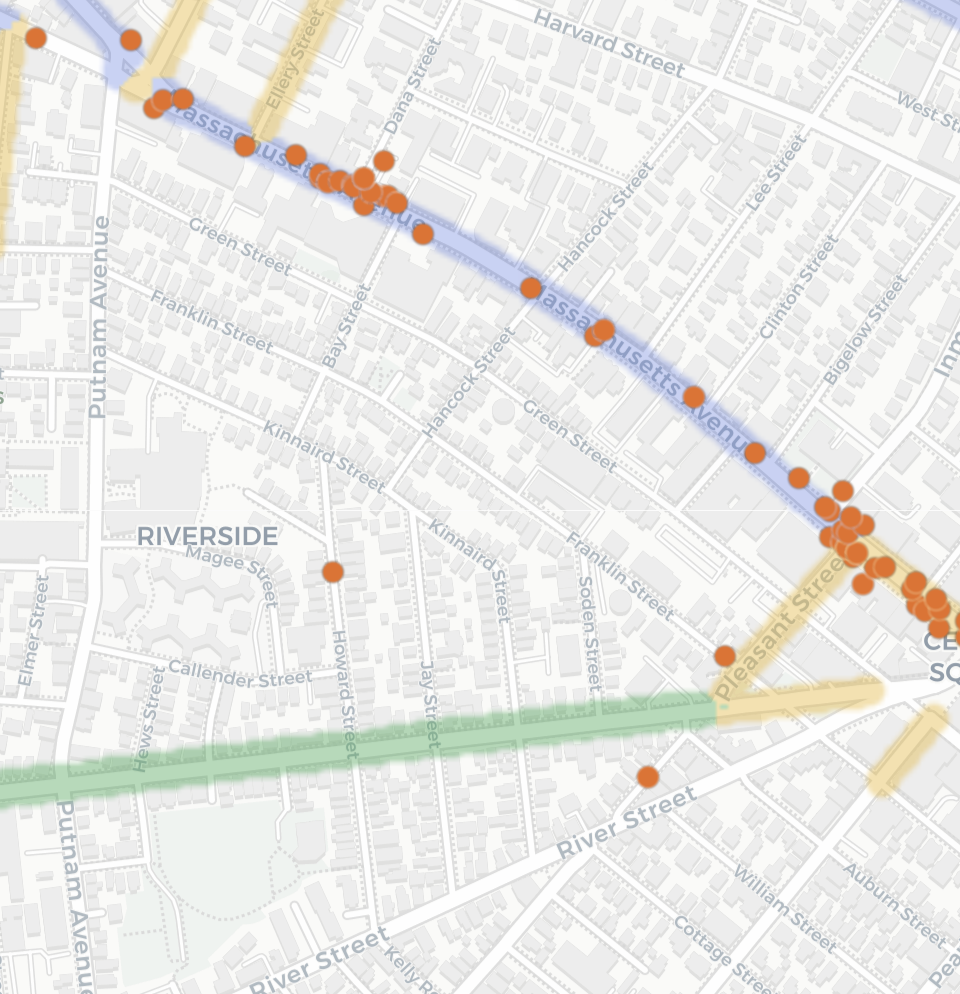
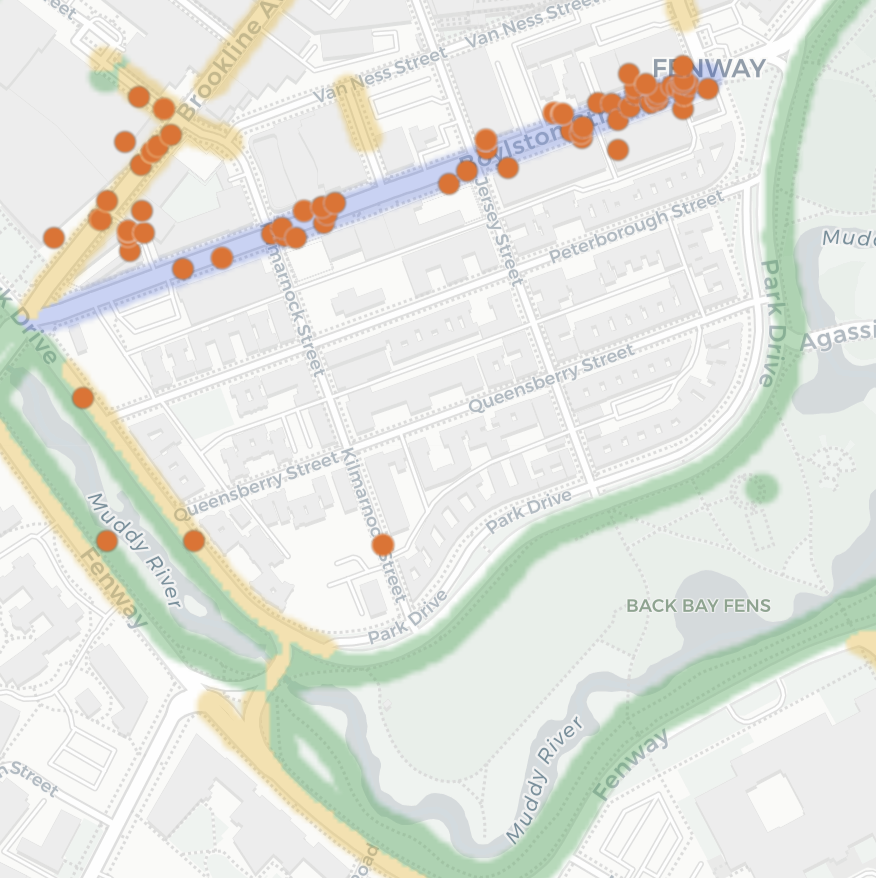
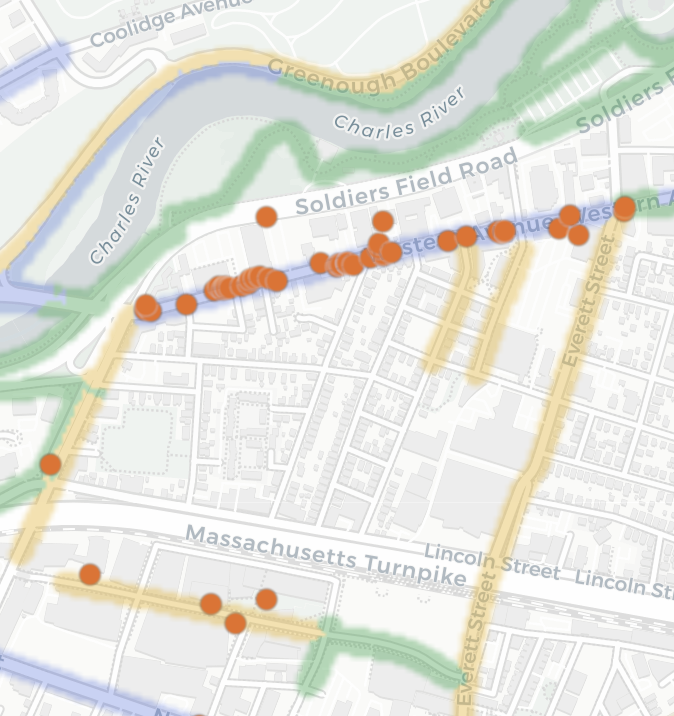
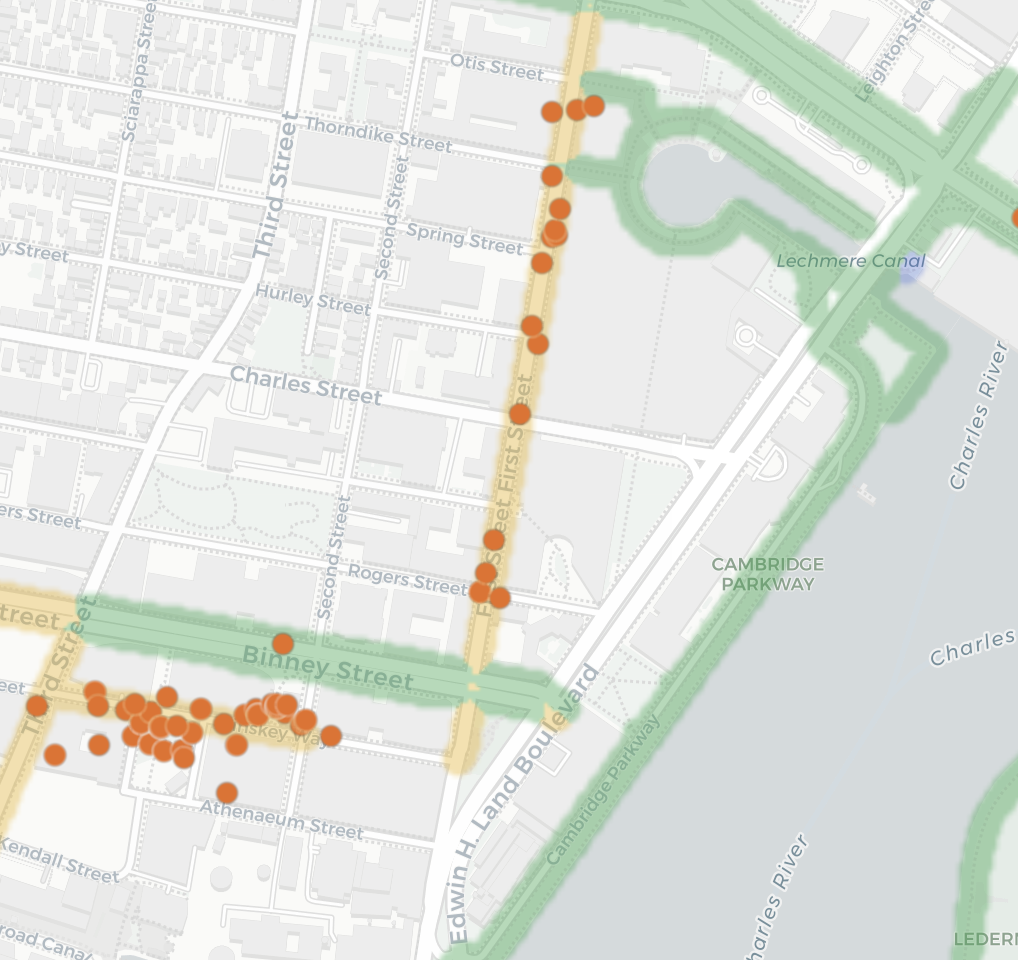
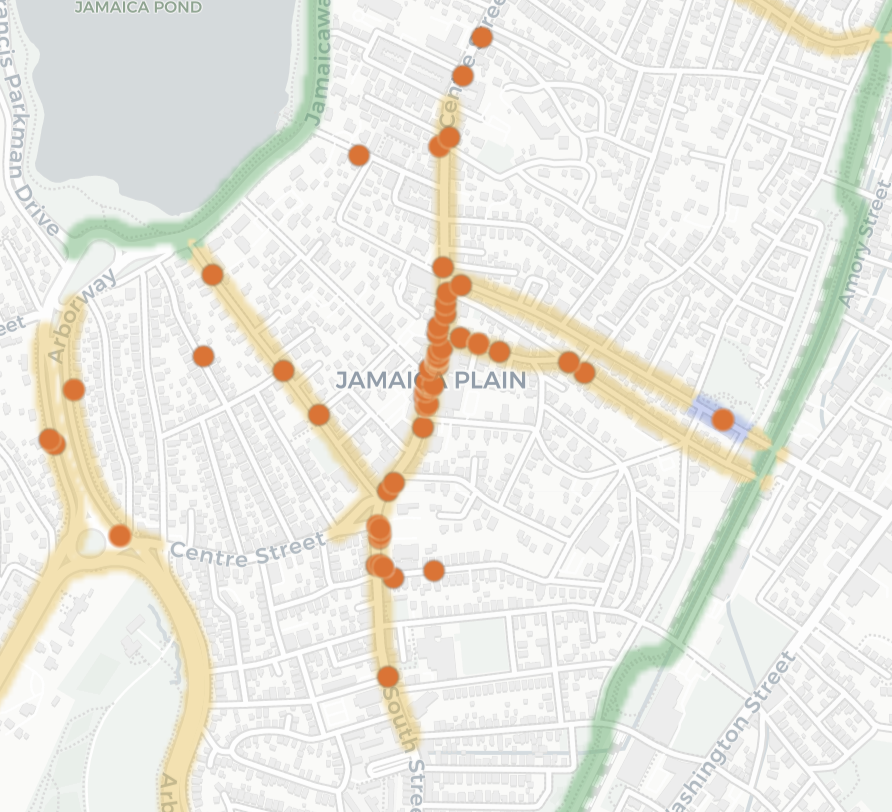
Tap any panel to open that neighborhood on the live map.
A parked car is evidence of a greater danger
Every orange dot marks a spot where a vehicle was parked blocking a bike lane. The green areas are separated bike lanes and the purple areas are “protected” bike lanes. If a car was physically able to enter the lane and park then the car can also barrel into someone biking in that lane. A separated lane solves both at once: no one can park in the lane and no one can be run over in the lane, the car simply cannot be there. That’s the only kind of protection that doesn’t depend on the person driving. Real barriers don’t fold.
References
- Loud Bicycle. “Bike Bureau: Report Bike Lane Obstructions.”
- Loud Bicycle. “Bike Bureau Public Map.”
- OpenStreetMap contributors. OpenStreetMap. Basemap and bike-lane data.