Visualizing Bike-Lane Obstructions
- Jonathan Lansey
- August 31, 2026
- 3 mins
- Research
- bike infrastructure bike lanes cities data visualization parking
Bike Bureau reports can be shown at several scales. These are the main visualization formats, ordered newest to oldest.
The live accumulation
August 2026 · interactive timeline
Each report is sorted by timestamp and added to the map at its recorded coordinates. Vehicle cutouts are separated with a repulsion solver so dense locations remain readable; the map and count stay tied to the underlying report set.
The controls scrub or play through the reporting period. The current build uses the August 2026 Boston-area report data and vehicle cutouts.
The traffic snake
August 2026 · physical scale comparison
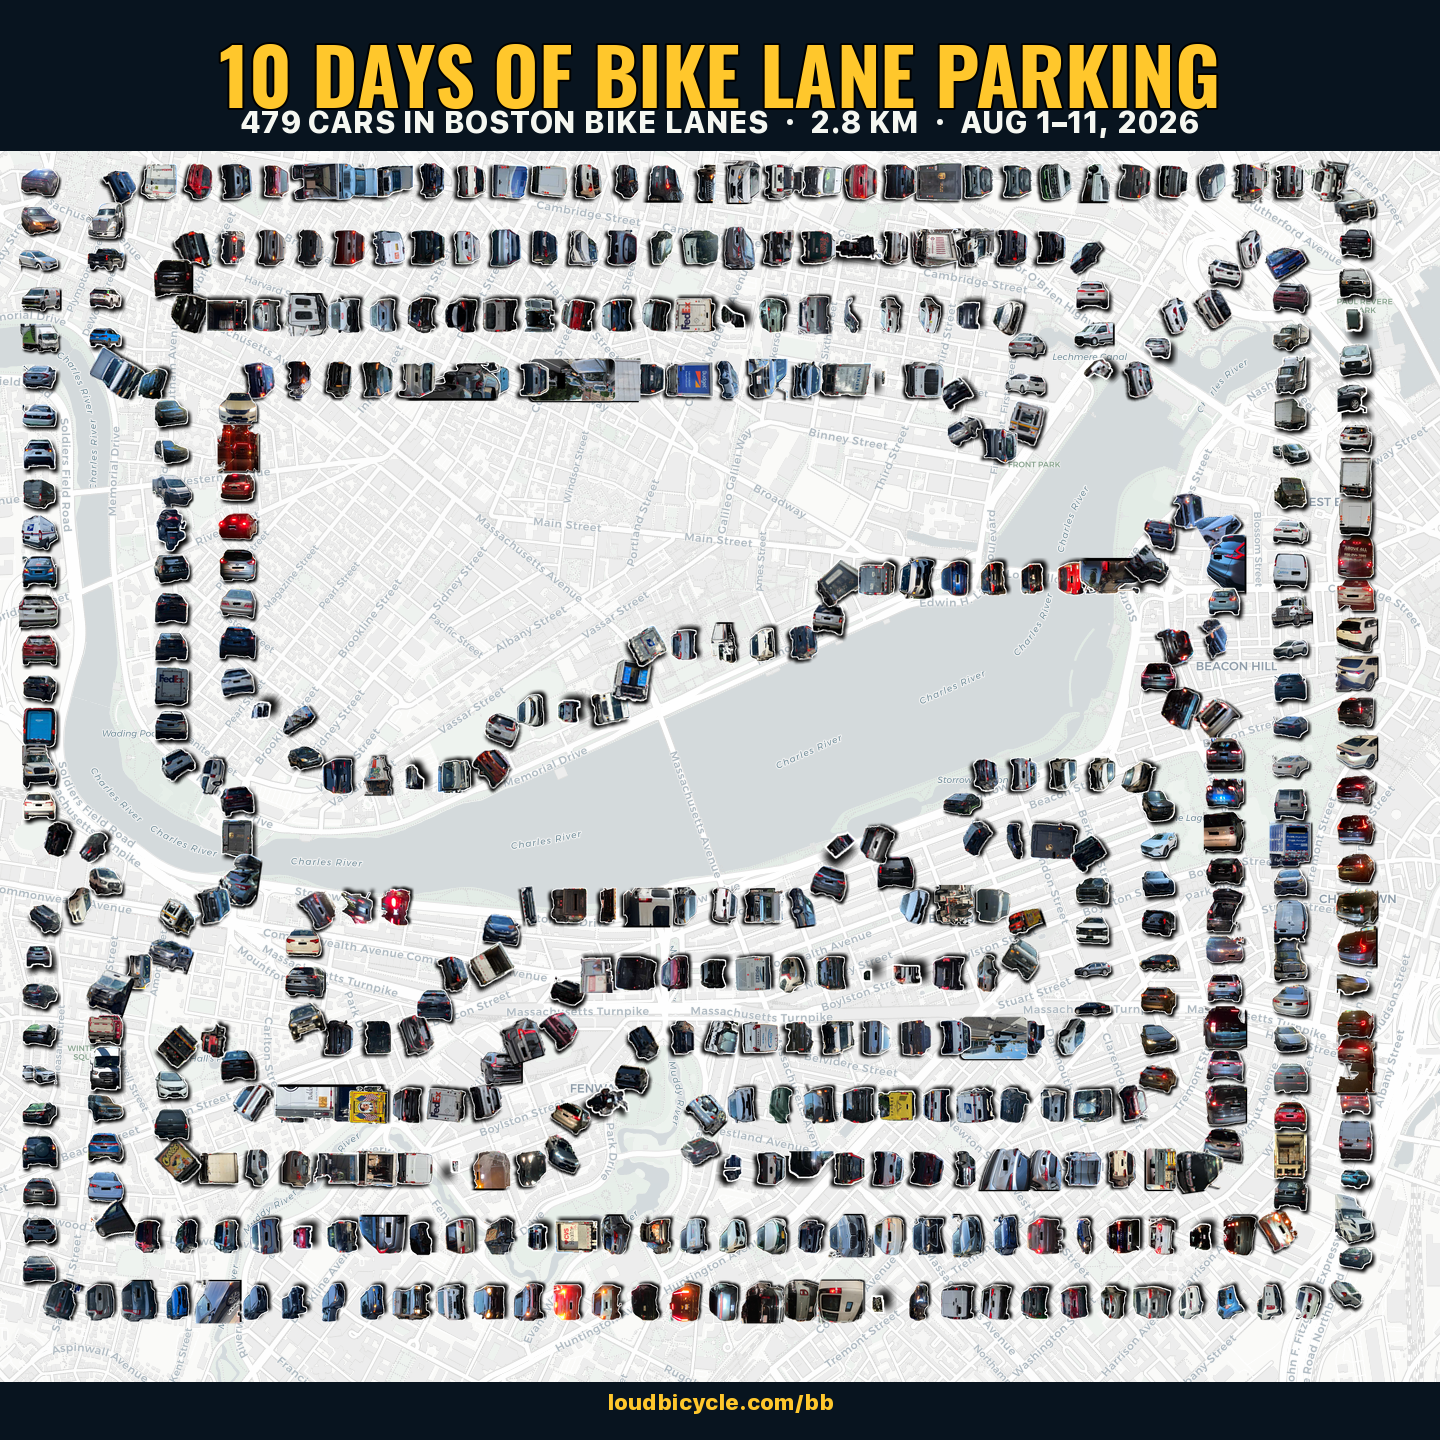
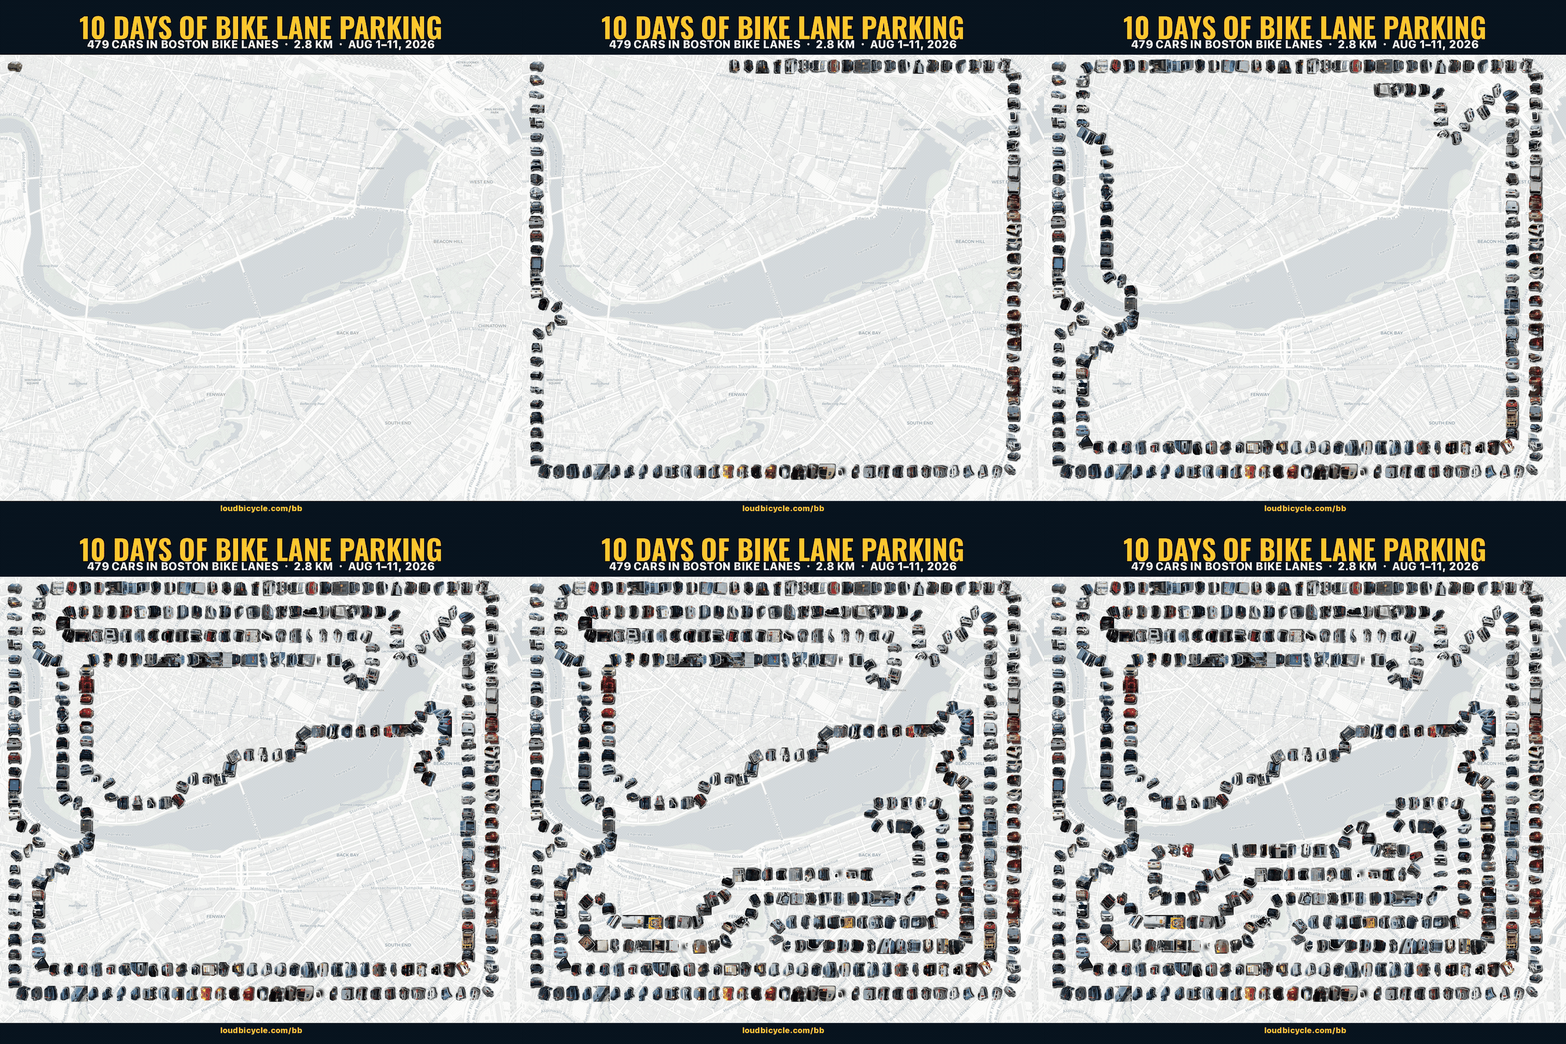
Four hundred seventy-nine public-safe reports were represented as vehicle-length units and routed along real streets around the Charles River. The result is 2.8 kilometers of reported obstructions as a single visual measure.
The citywide accumulation map
July 2026 · chronological map
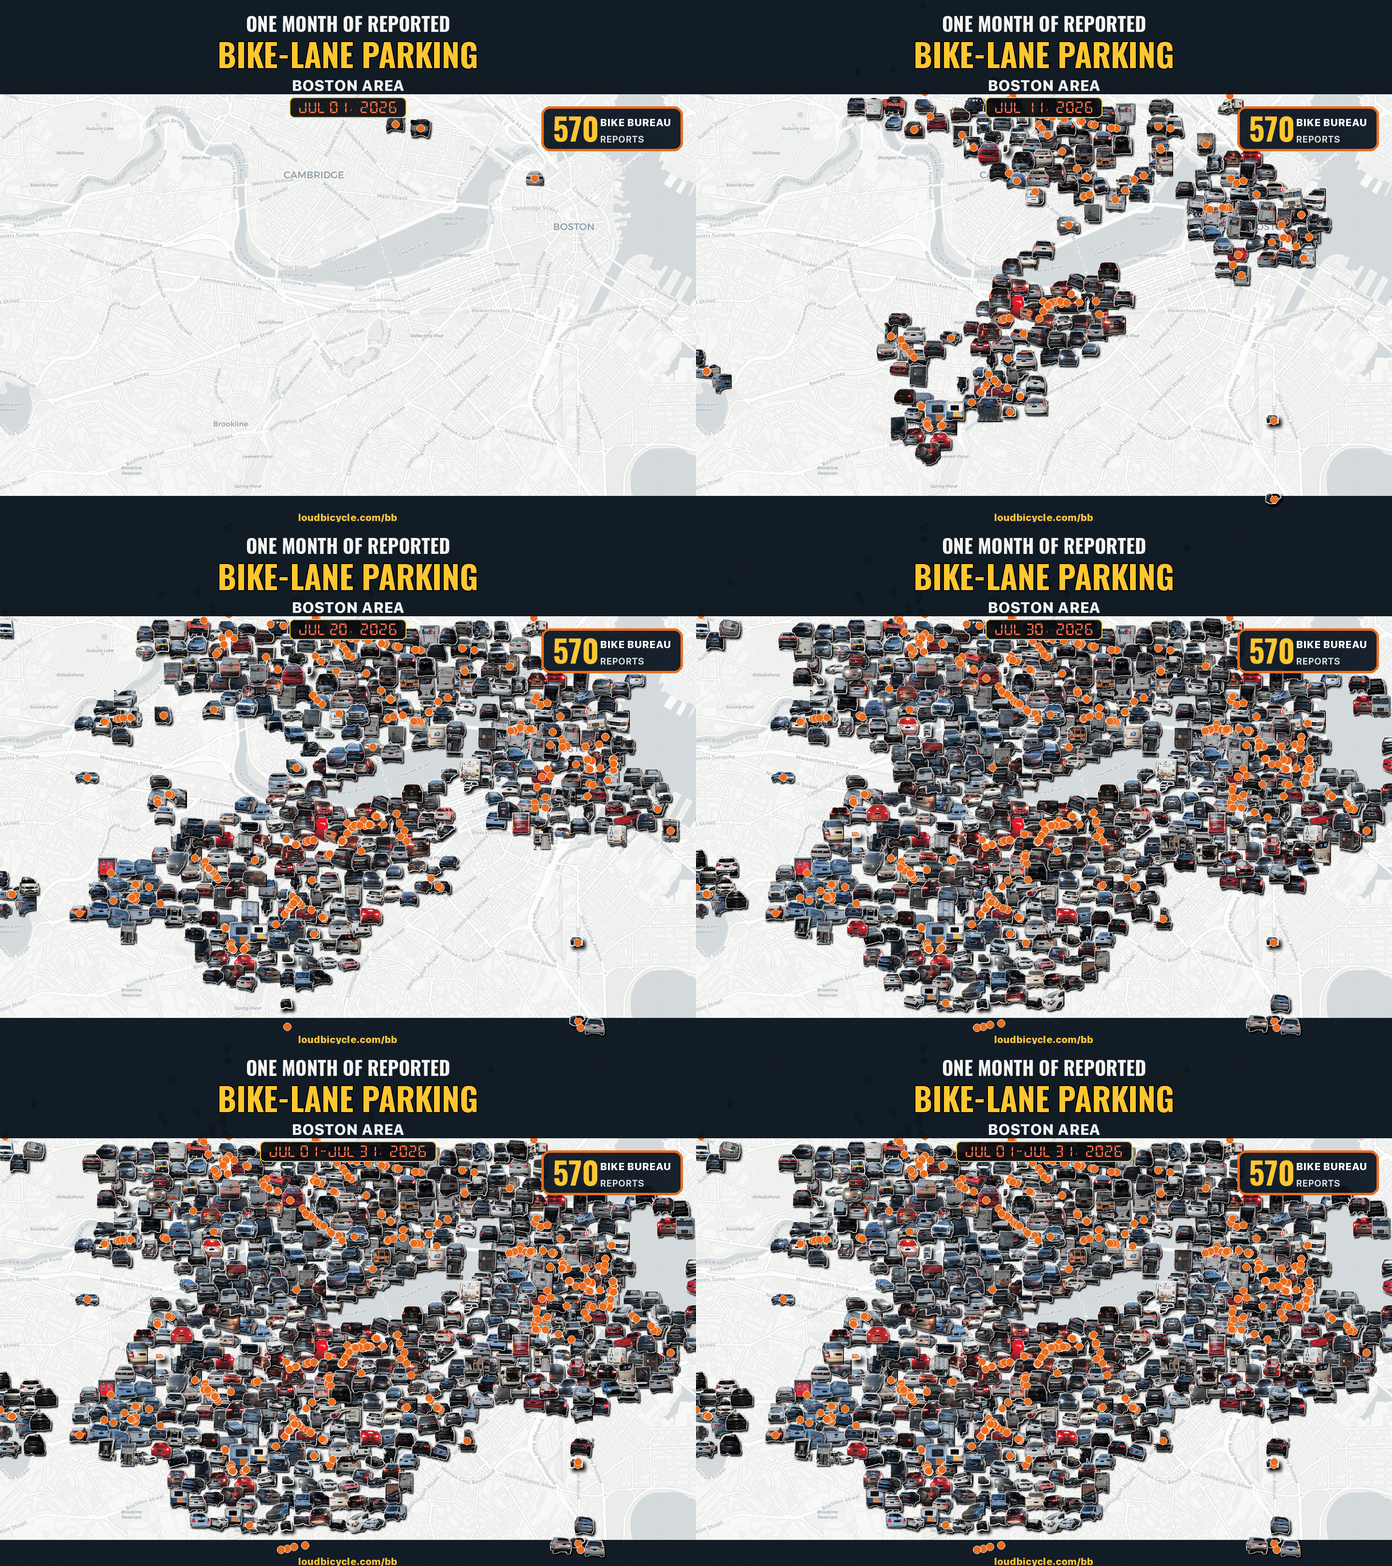
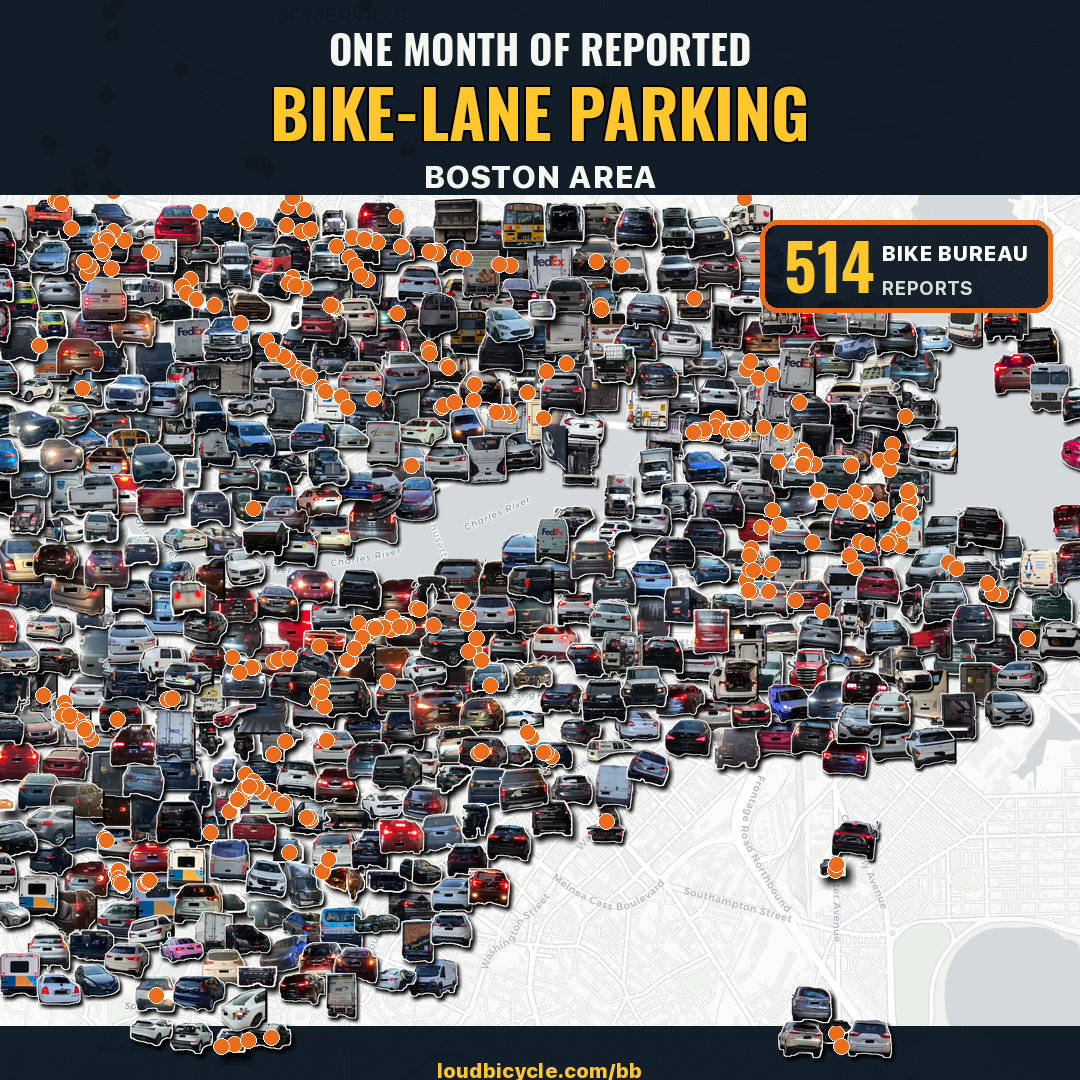
Five hundred seventy public-safe reports in the Boston-area viewport were placed by location and revealed in timestamp order. The still shows the final spatial distribution; the animation shows the rate and geography of accumulation.
Block-level hotspot reconstructions
June–July 2026 · repeated-location evidence
At smaller scales, report images are placed along the visible roadway or bike lane and labeled by time. These views isolate repeated activity at a loading zone or intersection and can combine Bike Bureau and public 311 records while keeping the sources distinct.
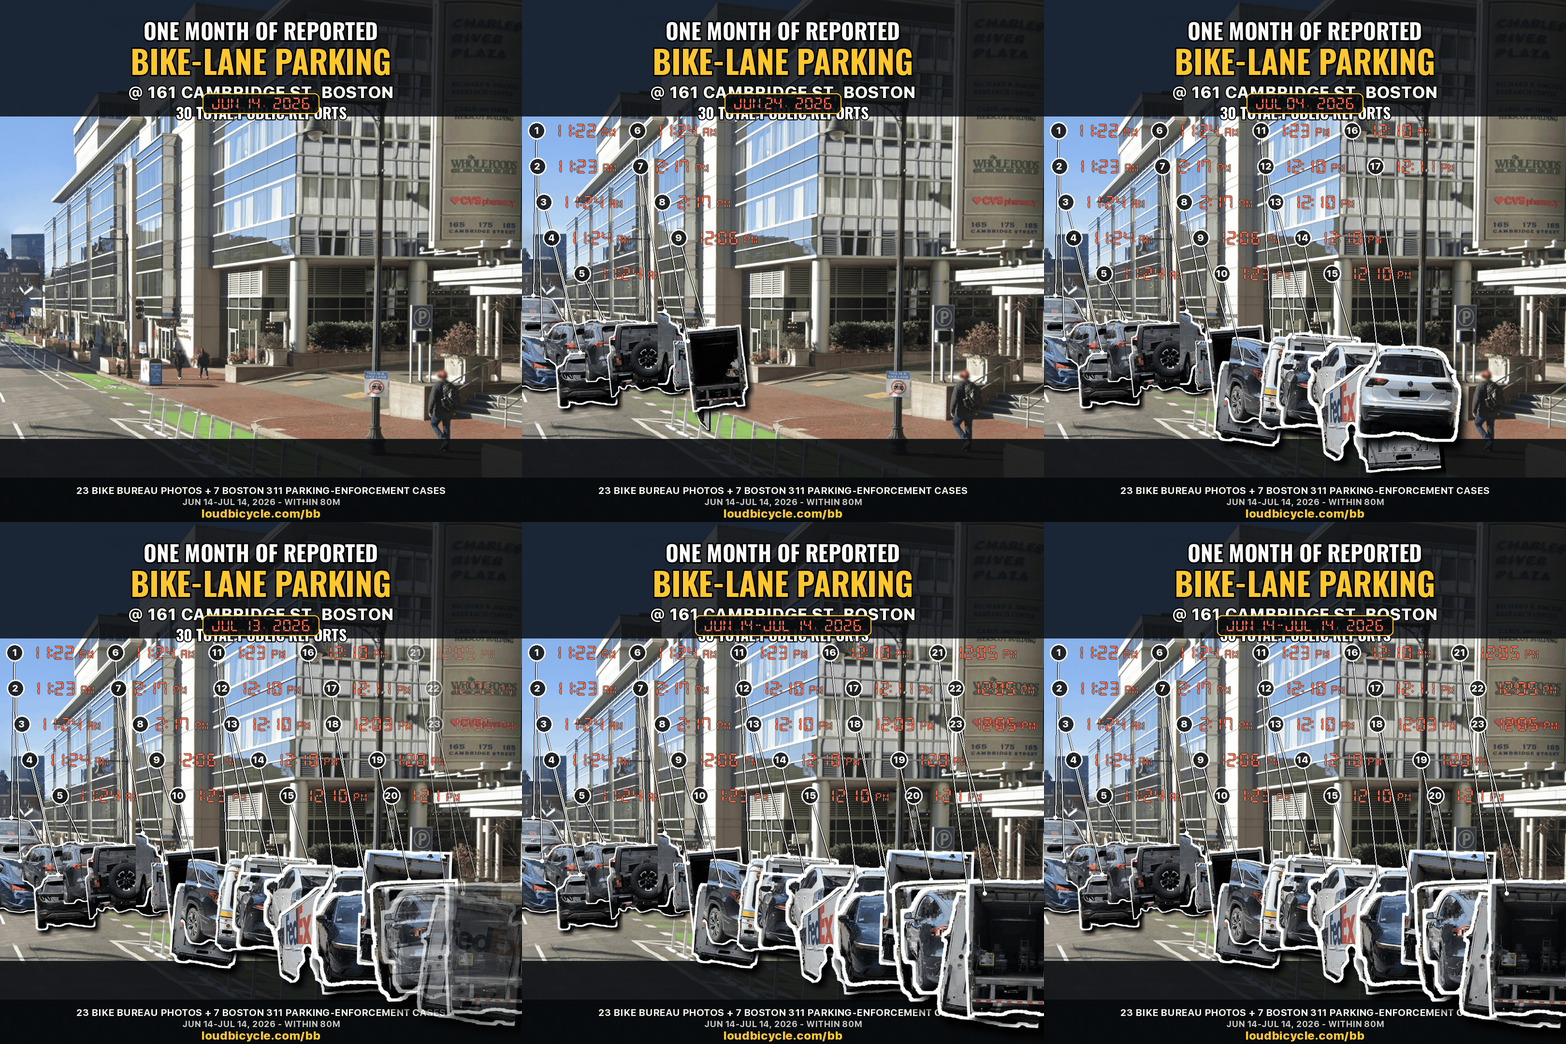
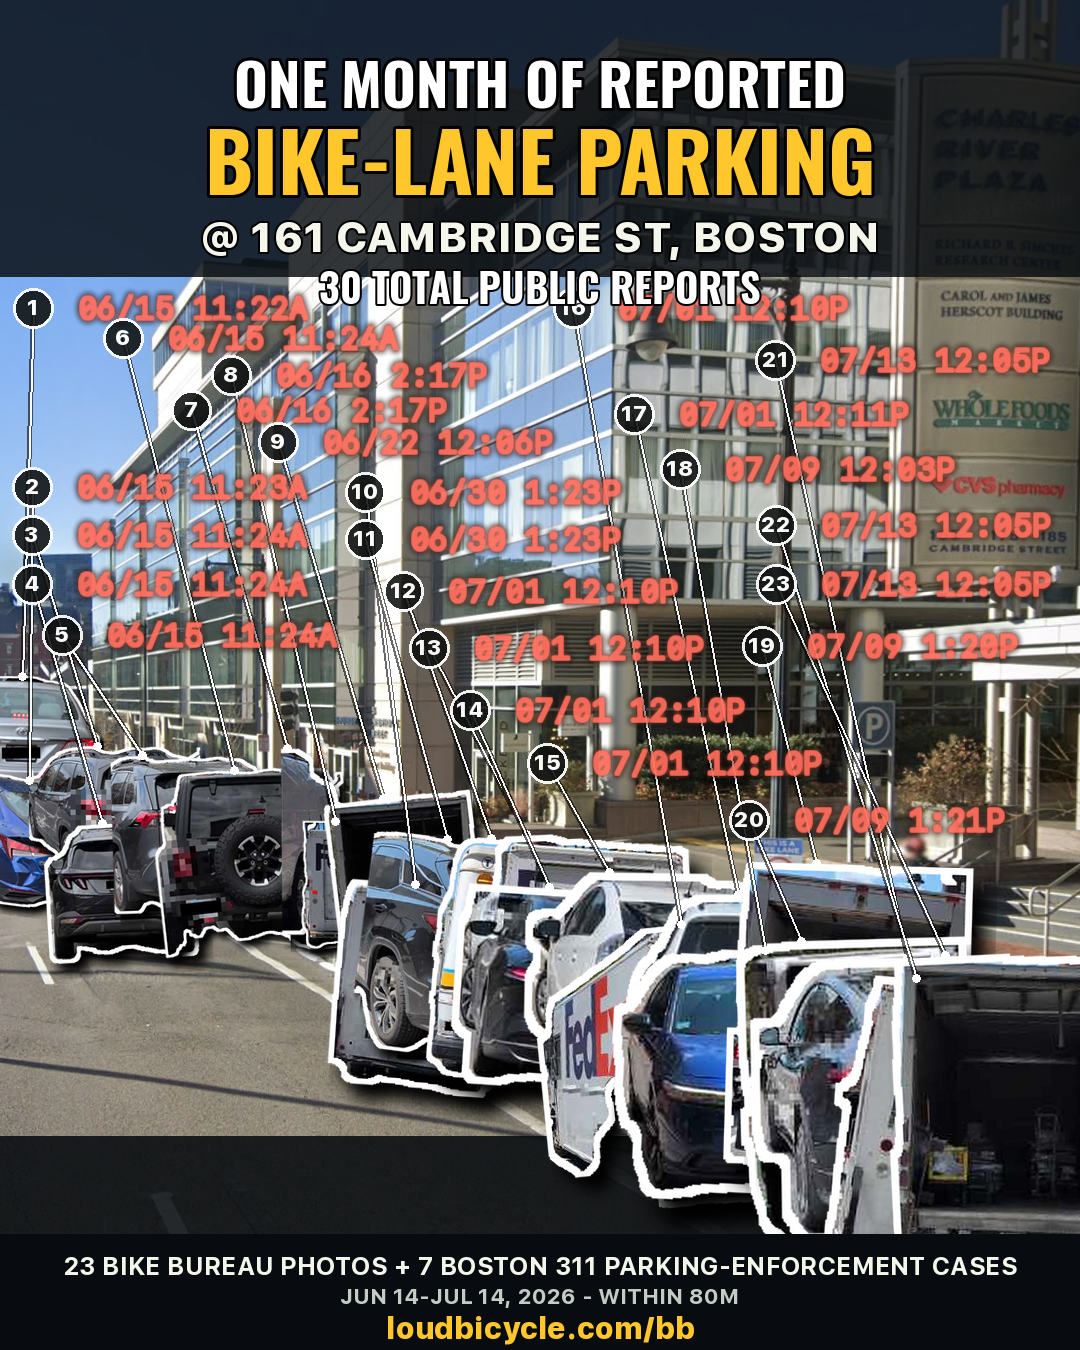
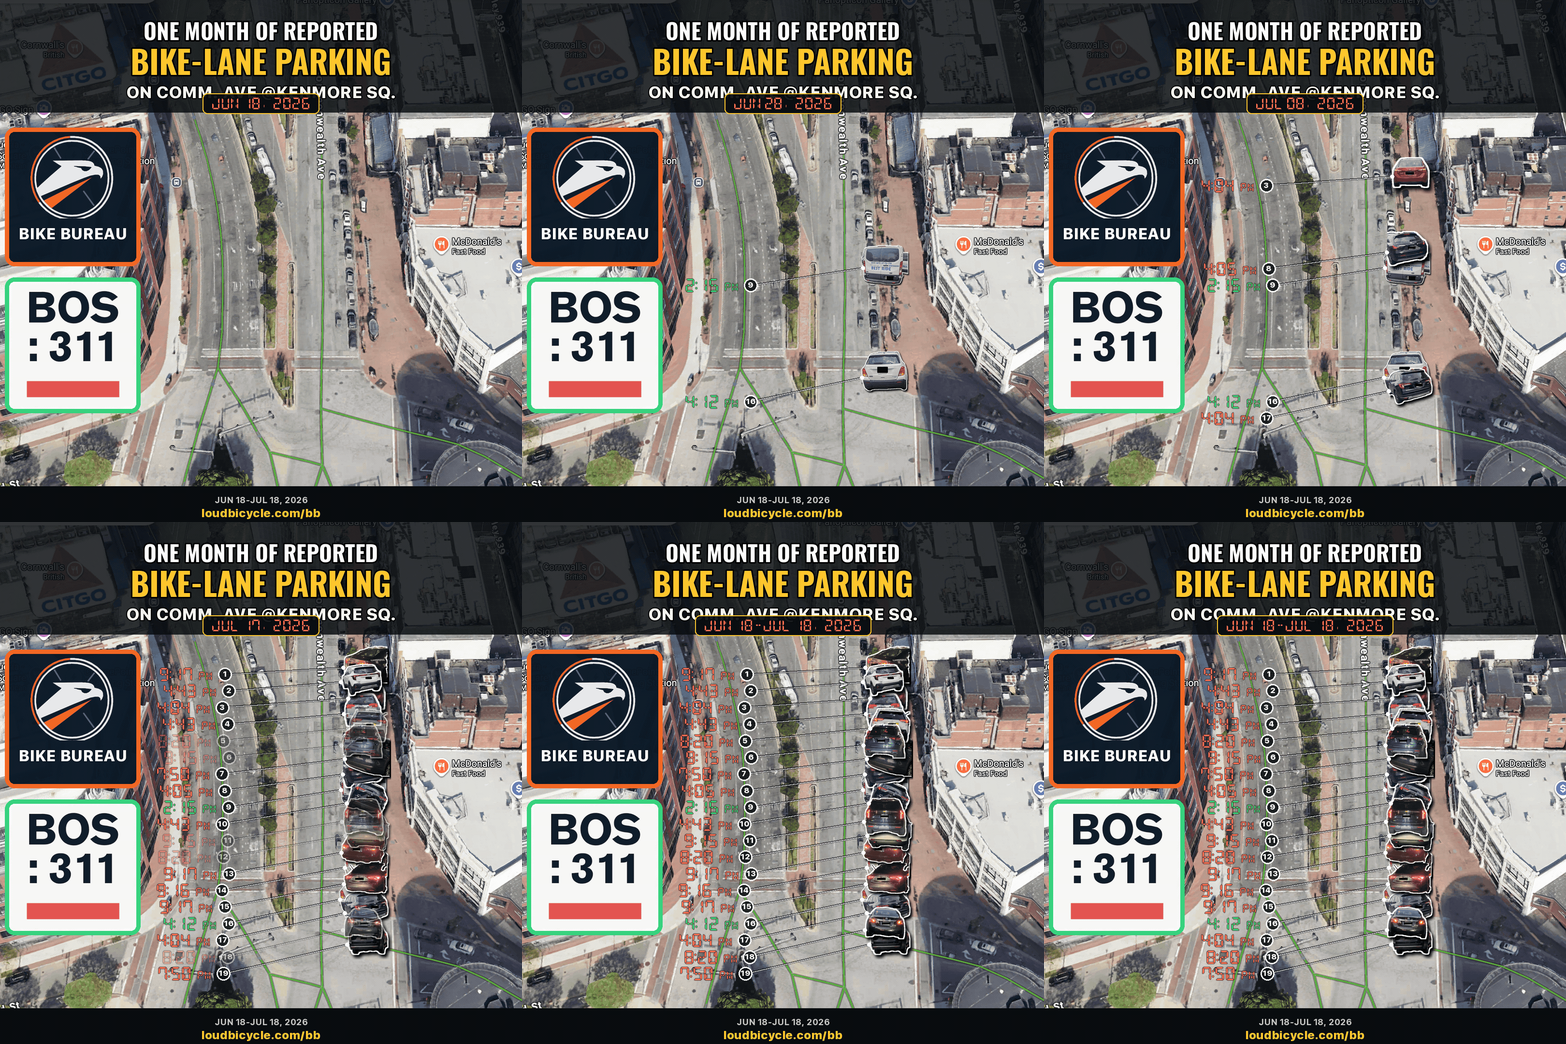
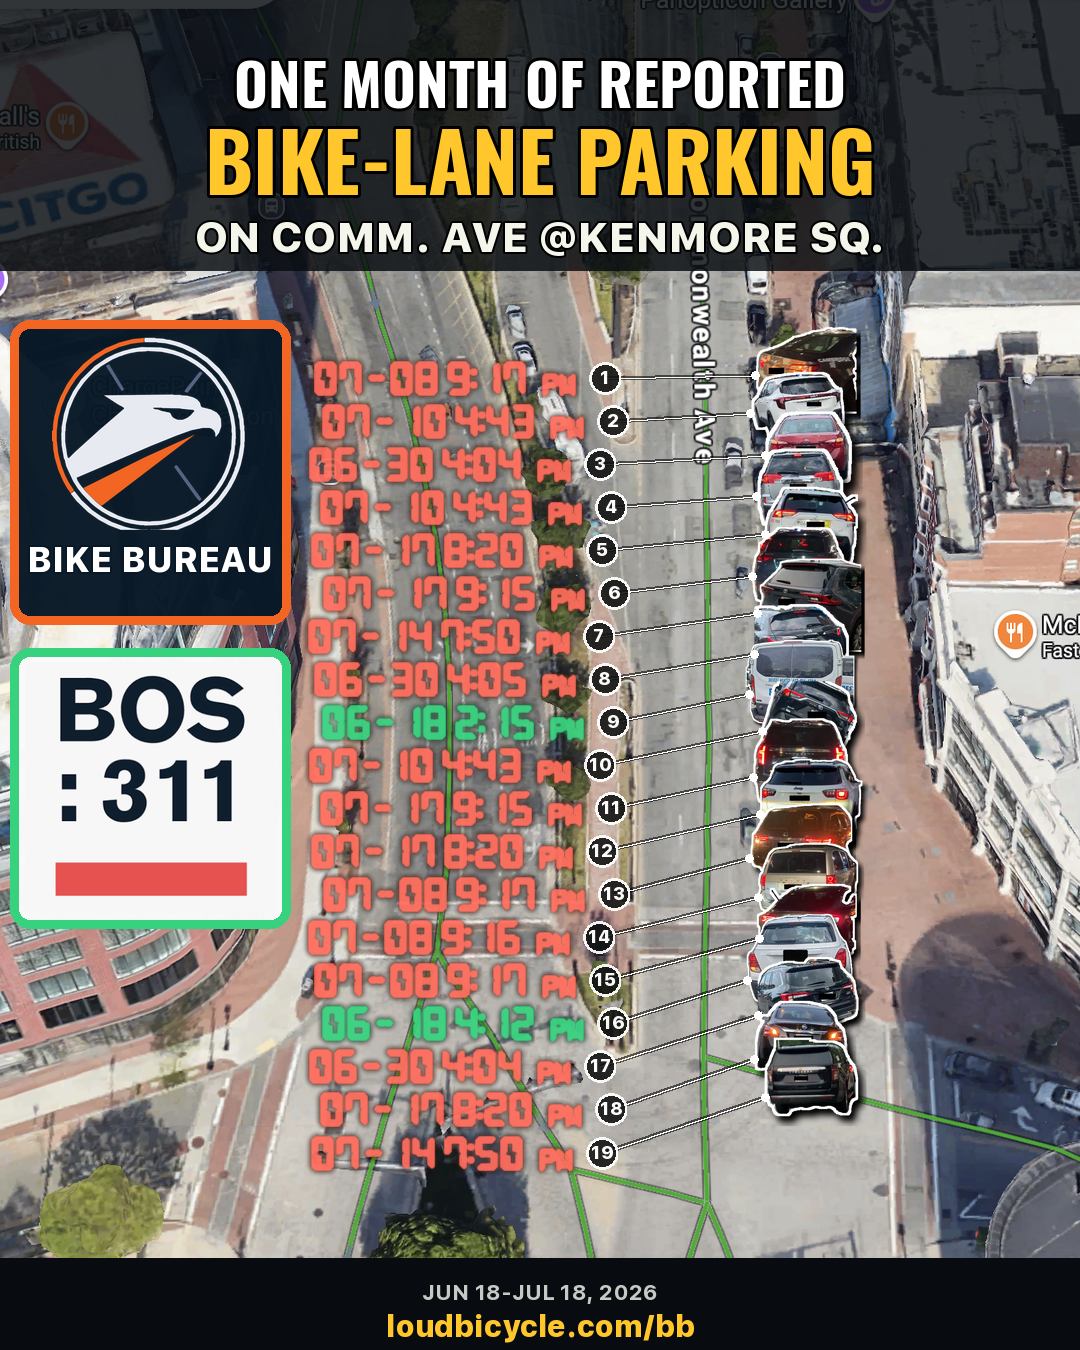
The common fields are report timestamp, coordinates, source image, and privacy treatment. The layouts change; the records do not.
Community posts and image reports
These Reddit posts by u/jlansey and u/loudbicycle share earlier photo collections, report maps, and visual summaries from the same Bike Bureau work. Each post is embedded below; use its title to open the original Reddit thread.
I spent a month documenting people parking in bike lanes in front of MGH
Chronic parking in the unprotected bike lane next to the Kenmore bus station
We love data in Boston right? Lets report all the cars in bike lanes.
We already know what kind of bike lanes actually keep people safe
Rules for Thee, Lanes for Me